Picture two versions of the same proposal page. One explains a system cutover in three dense paragraphs. The other shows the same plan as three steps on a timeline, with one sentence underneath that tells the evaluator what they gain. Most evaluators understand the second page in seconds and remember it at the scoring meeting. That is the case for graphics, and also the catch: the second page only works because someone decided what it had to say before drawing anything.
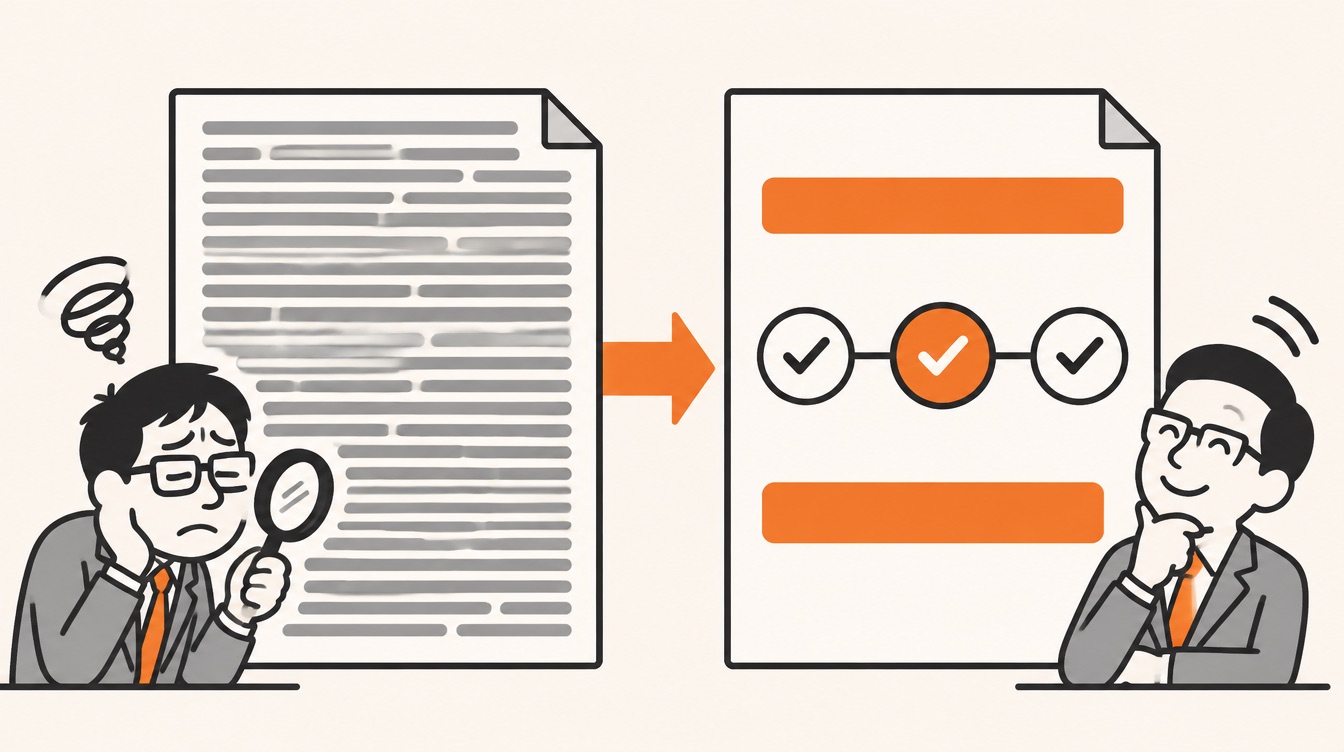
A proposal graphic is a message in visual form, not decoration. The APMP Body of Knowledge treats graphics as a way to make a proposal clearer and more persuasive, reaching evaluators through reason and feeling at once. The practical rules follow from that: decide the message first and write it as a one-sentence caption, design for what motivates the customer, draft key graphics early, test each one objectively, and render everything to one consistent standard.
This series works through the APMP Body of Knowledge as summarized in the APMP Foundation Study Guide. Episode 18 covered headings, the lines a reader sees before any sentence. This episode covers the elements an evaluator often looks at before reading anything at all: the graphics.
Why graphics win evaluations
The Study Guide makes a direct claim: clear, compelling graphics that focus on the audience, covers included, improve win rates. The reasons it gives are worth separating, because each one suggests a different way a graphic earns its space.
| What a good graphic does | What it means for the evaluator |
|---|---|
| Makes information easier to digest | Relationships, sequences and comparisons are visible instead of described |
| Communicates faster | The main point lands before the reader commits to the paragraph |
| Improves recall and understanding | The picture is what the evaluator remembers when scores are discussed |
| Reaches both reason and emotion | It can explain the logic and also create feelings such as trust |
| Signals professionalism | A well-made visual shows capability faster than claims about it |
| Highlights and differentiates | It points the eye to the strongest parts of your solution and sets the tone |
The guide also reports a study sponsored by 3M at the University of Minnesota's School of Management, which found that presentations using visual aids were 43% more persuasive than those without them. The guide illustrates the recall point with a simple contrast: a one-line verbal definition of a circle next to a drawing of one. You know which one you understood first.
Graphics are not better than words, they are better with words
None of this means you should replace text with pictures. The Study Guide is careful here and cites two authors, the graphics specialist Mike Parkinson and the researcher J.R. Levin, who make the same point from different directions. Without visuals, an idea can drown in text. Without words, a visual can be read several ways. Together, pictures and text produce more understanding and memory than text alone.
For a proposal, that means a graphic needs a sentence next to it that tells the reader what it means, and a block of text often needs a graphic that shows how the parts fit. The most useful question isn't "text or graphic?" but "which part of this message is easier to see than to read?"
Design for the customer, not for yourself
The Study Guide puts the most common failure bluntly: proposal graphics fail when the author makes them for the author, even though the author doesn't decide who wins. An org chart that shows your company's internal structure, a technology diagram that celebrates your architecture, a timeline that tracks your milestones rather than the customer's: each is accurate, and each answers a question the evaluator didn't ask.
The fix is the same one this series keeps returning to (see episode 5). Find out what motivates the evaluators and decision-makers: their needs, goals and pain points. Then the graphic can show your solution lined up against those needs and make your discriminators visible.
Four things buyers want
The Study Guide summarizes customer motivation as four kinds of benefit, depending on what the customer sees as good, as bad and as something they should have. Each one suggests a different shape of graphic. The example graphics below were written for this article.
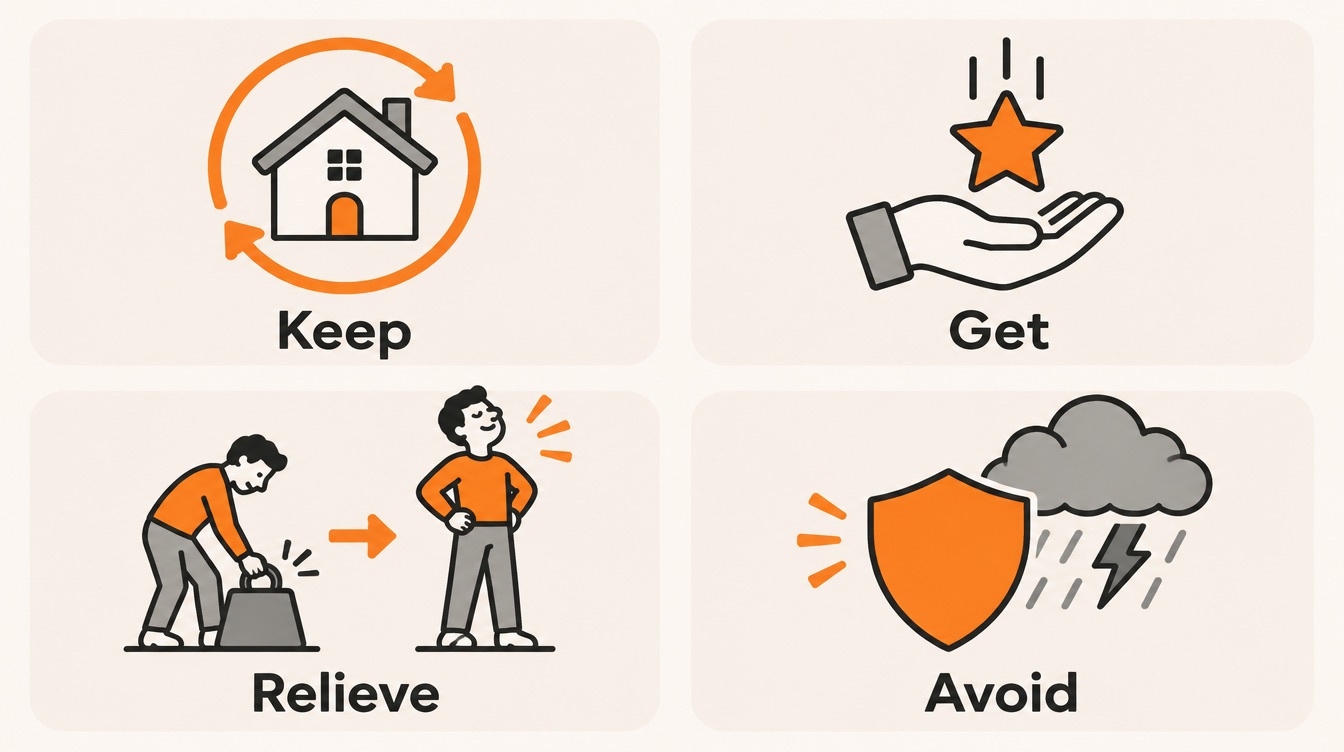
| The customer wants to | Meaning | A graphic that shows it (example) |
|---|---|---|
| Keep | Maintain something good they already have | Service levels held steady through every phase of a transition |
| Get | Acquire something good they don't have yet | A before-and-after view of the new capability in a user's day |
| Relieve | Get rid of something bad they have now | Manual steps in today's process, crossed out one by one |
| Avoid | Protect against something bad that could happen | Risks along the project timeline, each with the safeguard that blocks it |
Your understanding of the customer should shape a graphic's message, its content and even its look. The Study Guide gives a sharp example: a customer under financial pressure may react badly to a proposal that looks expensive, so the designer may tone down the style to avoid suggesting an overpriced solution. Aesthetics send a message too.
Draft graphics before you write
The Study Guide's most counterintuitive advice is about timing. Work out your messages and graphic concepts early, before the proposal is written. Doing so gives the team a shared picture of the story from the start, and it exposes gaps while there is still time to fill them. Draft graphics and their captions can even serve as a storyboard: the visuals become the skeleton the writers build the text around.
The guide goes further: start with a graphic that summarizes the entire proposal, usually for the executive summary (see episode 6), and keep it in view as a roadmap while the rest is developed. If the team can't agree on that one picture, it doesn't yet agree on the story.
The action caption
The tool that makes early drafting possible is the action caption: the sentence under a graphic that states what it proves and why that matters to the customer. A label names the graphic; an action caption makes the point.
Label
"Figure 3. Fare system cutover schedule"
Action caption
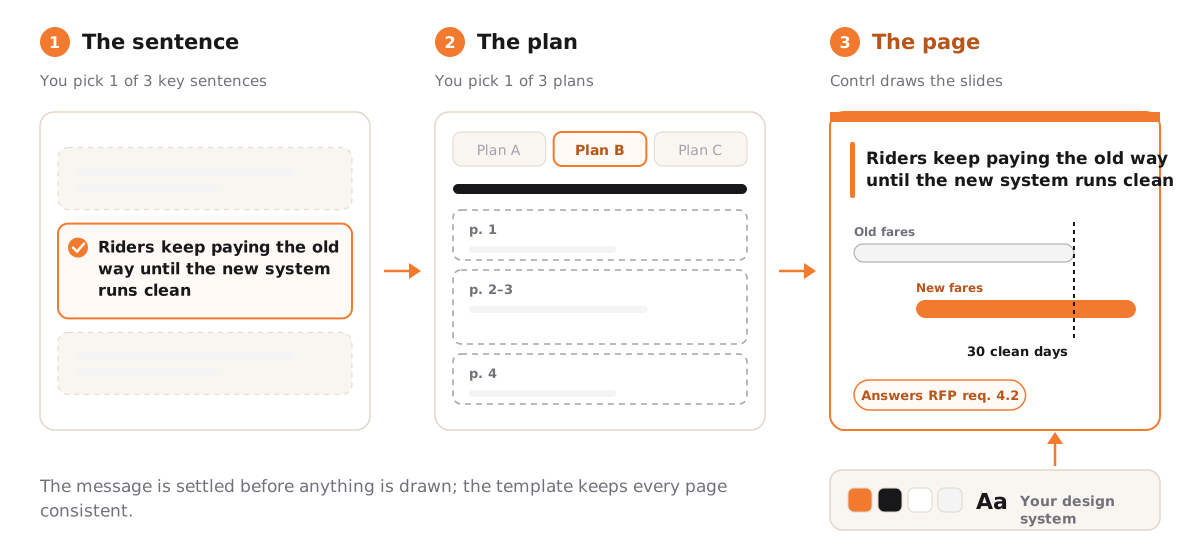
"Riders keep paying the old way until the new fare system has run cleanly for 30 days."
The label could sit under any bidder's schedule. The caption makes a claim the customer cares about (no disruption to riders) and tells the evaluator what to look for in the graphic above it. It is the same move episode 8 made for theme statements: one sentence, customer first, specific enough to score.
Four steps from message to graphic
Once you've picked which messages deserve a graphic, the Study Guide gives four steps. Here they are, applied to the fare system example above, which was written for this article.
- Summarize. State the graphic in one sentence. "Riders keep paying the old way until the new fare system has run cleanly for 30 days."
- Explain. List the details that support the sentence: old and new readers run side by side on every bus; the old system stays live as a fallback; the switch-off happens only after 30 days without a fare error.
- Visualize. Turn the sentence and details into a concept. A rough sketch is enough: two parallel bars on a timeline, the old one ending only after a 30-day "clean run" marker.
- Render. Turn the concept into a finished, professional graphic that follows the RFP's rules on size, fonts and format.
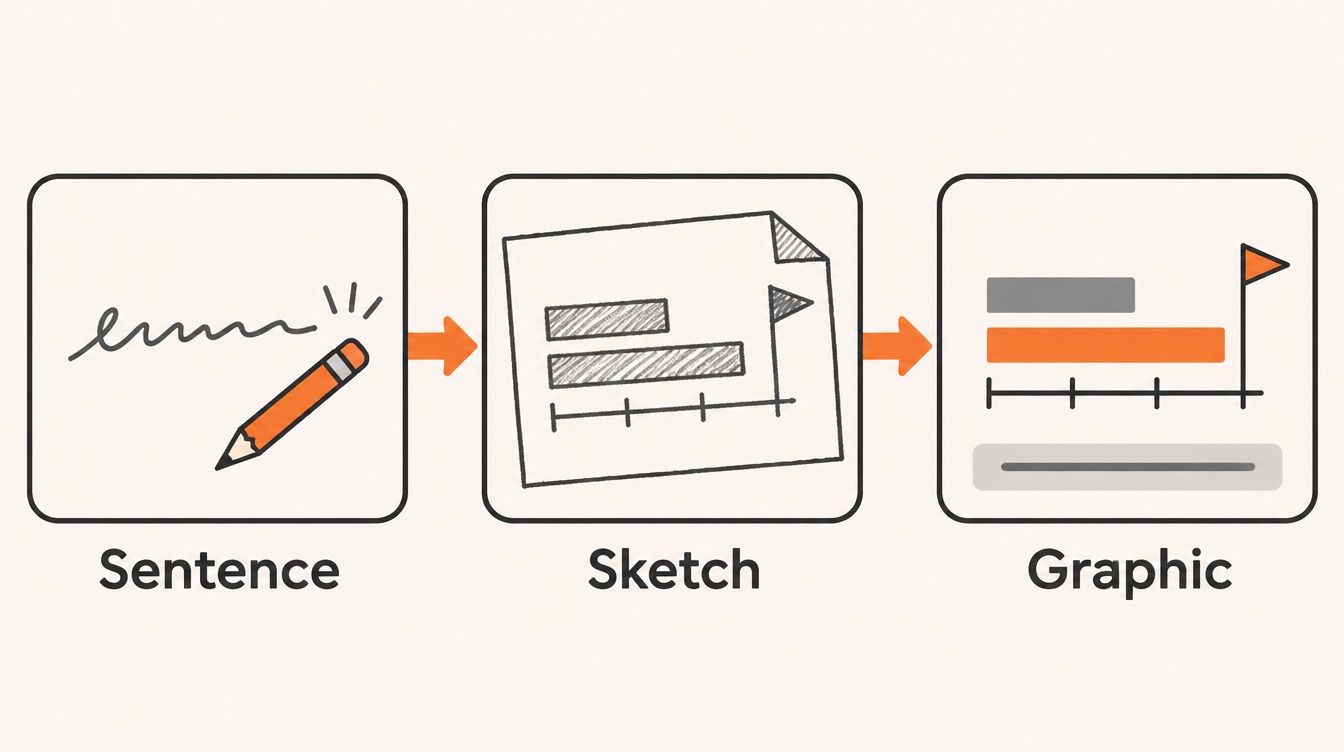
Notice that the first two steps don't involve drawing at all. By the time anyone opens a design tool, the message is settled and the details are chosen, which is why the result is simple. The guide adds that combining your organization's goals with the audience's expectations leads to better aesthetic choices in the last step.
Where designers fit
Where a designer enters the process depends on how mature the team is. In mature organizations, the Study Guide notes, the graphics process has defined stages (conceptualizing, rendering, tracking, editing), clear roles, trained designers, professional tools and libraries of graphic assets. Graphics are often made early, sometimes before the narrative. These teams also track how long graphics take to conceptualize, render and edit, which lets proposal managers schedule design support realistically, produce faster and spend less.
Test every graphic objectively
"I like it" is not a test. The Study Guide gives three areas to check, which I've turned into questions you can ask of any graphic:
| Area | Questions to ask |
|---|---|
| Goal | Does it satisfy what the RFP requires? Does it answer an important customer question, give information they asked for, or show a strong reason to choose you over a competitor? |
| Content | Cover the title and caption: does the message still come through? Does everything inside the graphic relate to that caption? |
| Aesthetics | Does each design choice have a reason? What does the style say about you? Does it match the other graphics in the proposal? |

Then step outside the team. Show the graphic to someone who doesn't know your solution. If they understand it, a broad audience of evaluators probably will too. If they need you to explain it, the evaluator will need the same explanation and won't have you there.
Types of proposal graphics
The Study Guide separates two broad categories. Traditional graphics are the kind used in documents and appear in both government and commercial proposals. Multimedia graphics, such as animation, web-based material and video, are more common in commercial bids, where fewer RFP rules constrain the format.
| Multimedia type | What it is | Think about |
|---|---|---|
| Web-based deliverables | Documents, videos or other material delivered through an online platform | Data security, and how the customer will get access |
| Video | Motion that brings a design to life | Production time and logistics, file size, and where the video is hosted |
| Interactivity | Animation and non-linear navigation, mostly in presentation files | How the customer will actually open and use it |
The common thread is access. A brilliant video the evaluation panel can't open on its secure network scores nothing, so confirm how the customer will receive and view anything that isn't a static page.
Six design principles
To look professional, every graphic should follow basic design principles that guide the eye, help understanding and build trust. Choices that clash with the audience, the message or the subject work against you. The Study Guide names six principles that proposal designers rely on most.
| Principle | What it does | In practice |
|---|---|---|
| Color | Color and contrast are usually noticed first; colors carry cultural and subject meanings and affect mood | Choose every color on purpose, for example one accent color reserved for the customer's benefit |
| Style | Communicates your culture and how you approach service and problems | Match the style to the customer and the message, not to fashion |
| Consistency | Shared colors, styles, lines and fonts show a team working in step; it takes effort, so it signals commitment | Use one set of fonts, line weights and icon styles across every volume |
| Grid | An invisible grid keeps elements evenly spaced and orderly | Align boxes, labels and arrows to the same columns and rows |
| Balance | When the halves of a graphic carry similar visual weight, it feels stable; imbalance feels uneasy | Check left against right first, then top against bottom |
| Shapes | Diagonals feel energetic but, overused, look messy; horizontals and verticals feel stable and controlled; curves feel calming | Use straight horizontal and vertical lines for plans and structures; save diagonals for emphasis |
Templates
Templates turn these principles into habit. They keep graphics consistent and compliant, reduce redesign and save production time. They also give the whole proposal one look, which the Study Guide notes is what evaluators expect from a mature organization. Settle in the template itself how recurring elements like icons and symbols should look, so every designer and every proposal uses the same set.
Production basics
A handful of practical rules keep good graphics from failing at the last step.
- File formats. Proposal graphics come in two main formats, vector and raster. Which one to use depends on the style, how the graphic is used and how the proposal is submitted. Create each graphic at the size it will appear in the proposal to avoid trouble with fonts and file sizes.
- Content management. Keep graphic assets in one central repository, with a clear naming convention, version control, descriptive metadata and tags, an agreed review and approval workflow, regular backups, a style guide, and training so the team can actually use all of it.
- Copyright. Images are protected by copyright automatically in almost every country, notice or no notice. Unless an image is in the public domain or your use is covered by fair-use rules, get the owner's permission, free or paid. When you buy images, confirm the license covers commercial use and not only editorial use.
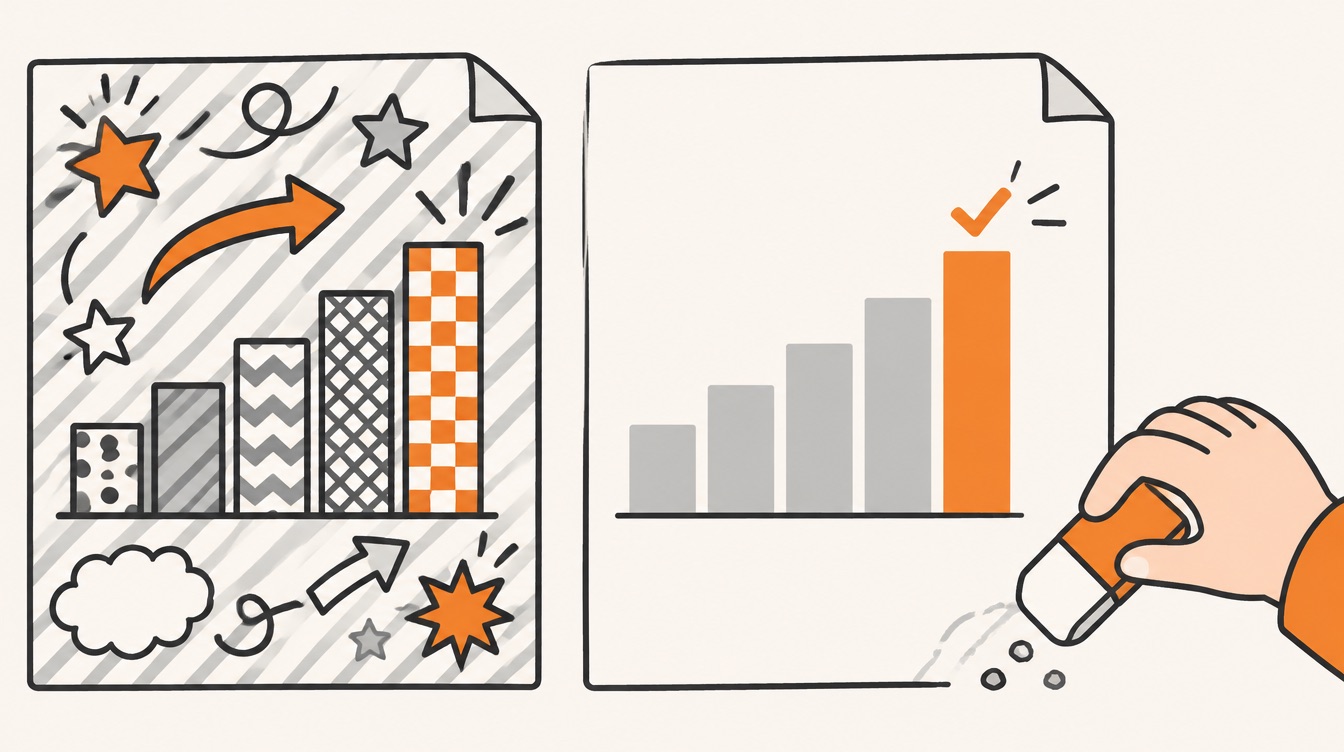
- Visual noise. Almost every proposal graphic exists to clarify. Leave out decoration that doesn't help, such as textured backgrounds.
- Accessibility. Follow accessibility standards so everyone on the evaluation panel has equal access to the information, whatever their way of taking it in.
Common mistakes
- Drawing before deciding. Skipping the one-sentence summary means designing without knowing the point, which wastes time for designers and writers alike.
- Too much in one graphic. Several messages at once, details unrelated to the caption, or content no one edited make a graphic hard to read. Aim for one message.
- Assuming the reader knows what you know. A graphic that is obvious to the author may be opaque to an evaluator. Find out how much the audience knows about the subject before you design.
- Design choices without reasons. Poor rendering looks generic at best and amateur at worst. Work with a trained designer, follow the design principles and have an objective reason for each choice.
- Confusing two skill sets. Coming up with a concept and rendering it well are different skills, and not every designer has both. Know which one the task needs before you assign it.
- No quality control. Spelling errors, missing or repeated content and inaccessible graphics reflect on your whole company. Spell-check, cross-check, test every link in interactive files, and ideally have someone else review your work.
Checklist for your next proposal
- List the messages that deserve a graphic, starting with one graphic that summarizes the whole proposal.
- Write each graphic's action caption first, in the customer's terms: what it proves and why they care.
- Match each graphic to a customer motivation: what they want to keep, get, get rid of or avoid.
- Follow the four steps: summarize, explain, visualize, render. Don't open a design tool until the first two are done.
- Use draft graphics and captions as a storyboard before the narrative is written.
- Test each graphic on goal, content and aesthetics, and show it to someone outside the team.
- Render to a template that fixes colors, fonts, line styles and icons, and create each graphic at its final size.
- Check rights, noise and accessibility: licensed images only, no decorative clutter, accessible to every reader.
- Run quality control on spelling, duplicates and links, and track how long graphics take so you can plan the next proposal.
Where Contrl fits
The most important rule in this episode is the order: settle the message in one sentence before anything is drawn. Contrl works in that order for each section. You first pick the section's key sentence from three candidates reduced from your win theme, or write your own, and then pick one of three plans for how the section unfolds. Only after that does Contrl write the slides, in your company's design system, so colors, fonts and layout come from one template on every page, and each page cites the RFP requirements it answers. The message is decided before the drawing starts, the template handles consistency, and the citation answers the Goal question before an evaluator asks it.
Next in the series
A good graphic still sits on a page, and the page has its own design. Episode 20 covers Page and Document Design: how a document template and a few design techniques make a whole proposal compliant, consistent and easy to evaluate.
This article is an independent study companion based on the APMP Foundation Study Guide, version 4.2 (© 2025 APMP), which summarizes the APMP Body of Knowledge. It paraphrases and comments on that material and is not endorsed by APMP. The opening scene, the fare system example and its action caption, the example graphics for keep, get, relieve and avoid, the "in practice" column of the design principles table and the illustrations were written for this article, and their figures are illustrative; no customer is named. For the authoritative text and certification information, see apmp.org.